의사결정나무 (Decision Tree) 는 데이터를 나무와 같이 특정 feature로 지속적으로 분기하면서 목표 변수를 예측하는 머신러닝 모델의 하나로 간단함과 좋은 설명력으로 굉장히 많이 쓰이는 모델입니다. 분기를 하는 방법에 따라 여러 알고리즘이 있지만 대표적으로 CART (Classification And Regression Trees) 라는 알고리즘이 주로 사용되며 수치형/범주형 feature에 대해 gain이 가장 크도록 노드를 두 개로 분할하는 binary tree 형태를 가집니다.
따라서 의사결정나무 훈련 시에는 노드를 분할할 때 어떠한 feature를 사용해서 어떠한 기준으로 나눌지 결정하는 것이 제일 중요한 작업입니다. 일반적으로 분류 시에는 Gini impurity라는 개념을 사용하고 회귀 시에는 mean squared error 를 사용하여 "Information Gain" 이 가장 높게끔 분기하게 됩니다..

Information gain 이란 의사결정나무가 특정한 feature로 분기를 함으로써 얻는 성능적인 이득을 총칭하며 이를 기반으로 feature importance 를 구합니다. sklearn 패키지 안에서 의사결정나무의 feature importance를 쉽게 구할 수 있으며, 의사결정나무의 배깅/부스팅 앙상블인 Random forest/XGBoost/LightGBM 에서도 feature importance를 쉽게 구할 수 있습니다.
이번 포스트에서는 scikit-learn에 구현되어 있는 Random Forest 의 feature importance가 어떻게 구현되어 있는지 살펴보도록 하겠습니다.
Gini impurity
먼저 $K$개의 클래스를 분류하는 문제를 생각해 보겠습니다. 각 샘플에 특정 클래스에 속할 확률을 $p_i$라 정의할 때 노드 $N_j$에서의 Gini impurity 는 다음과 같이 정의됩니다.
$G(N_j) = \sum_{i=1}^K p_i (1-p_i) = 1 - \sum_{i=1}^K p_i^2$
해당 노드에서 샘플들이 균등하게 분포되어 있을 경우 Gini impurity가 높아지게 됩니다. (마찬가지의 원리로 엔트로피 또한 높아집니다) 분류 시에는 이 Gini impurity 가 최대한 감소하는 방향으로 노드를 분기하게 됩니다. 다음과 같이 총 샘플이 400개인 이항 분류 문제에서 $G(C_1), G(C_{1,left}), G(C_{1,right})$ 는 다음과 같습니다.

$G(C_1) = 1-{(200/400)^2+(200/400)^2}=0.5$
$G(C_{1,left}) = 1-{(150/200)^2+(50/200)^2}=0.25$
$G(C_{1,right}) = 1-{(50/200)^2+(150/200)^2}=0.25$
$C_1$에서 노드가 분기하면서 샘플의 클래스가 한 쪽으로 쏠리게 되므로 자식 노드들의 Gini impurity는 감소했습니다. 이 상황에서 각 노드의 Importance gain 을 계산합니다. Importance gain 은 노드를 분기함으로써 얻는 성능 이득 (여기서는 Gini impurity의 감소) 이니, 현재 노드의 Gini impurity 에서 자식 노드의 Gini impurity를 샘플 수의 비율만큼 가중치를 곱해서 뺀 값으로 다음과 같습니다.
$I(C_j)=w_j G(C_j)-w_{j,left} G(C_{j,left}) - w_{j,right} G(C_{j,right})$
이고 이를 통해 $I(C_1)=1*0.5-(200/400)*0.25-(200/400)*0.25$ 로 계산할 수 있습니다.
이제 $i$ 번째 feature importance $I(f_i)$를 계산할 수 있습니다. $I(f_i)$는 전체 노드의 importance gain의 총합해서 $f_i$에 의해 분기된 모든 노드의 importance gain의 비율로 정의됩니다.

마지막으로 모든 feature importance의 합으로 나누어 정규화합니다.

추후에 살펴볼 앙상블 기반의 Random Forest/XGBoost 등 모델의 feature importance는 여러 의사결정나무가 합쳐진 것이므로 각 나무의 feature importance를 평균을 내어 사용하게 됩니다. 이 방법을 Mean Decrease in Impurity (MDI) 방법이라 합니다.
Example
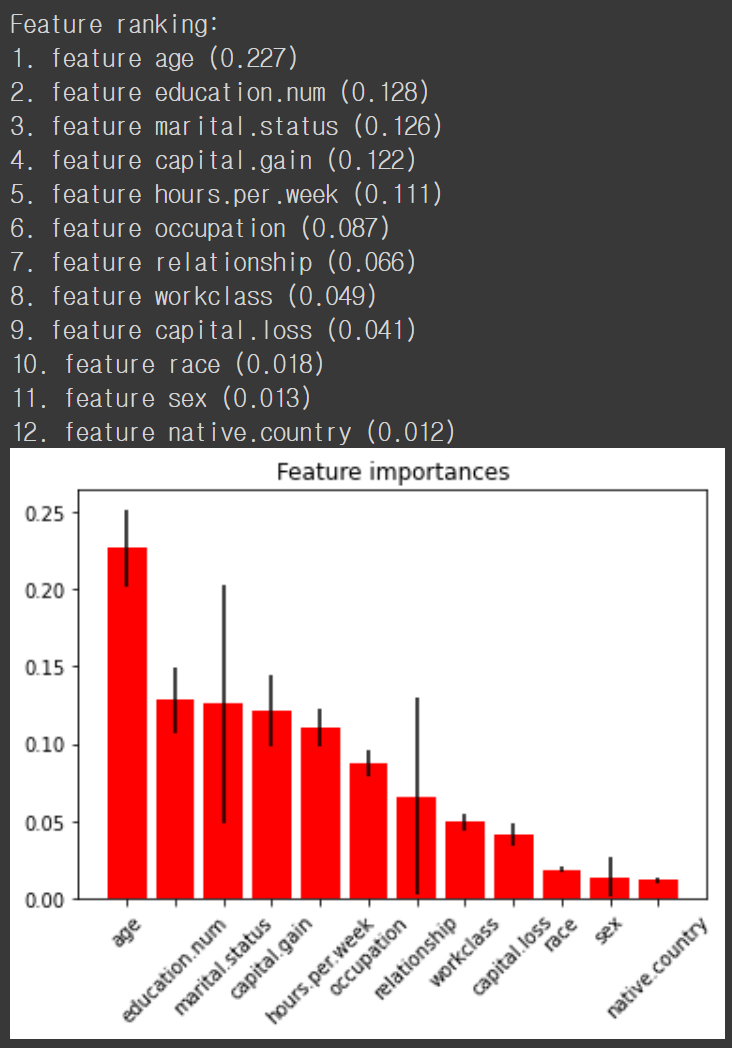
파이썬에서는 sklearn 패키지를 이용해 쉽게 feature importance 를 구하고 시각화할 수 있습니다.
from sklearn.ensemble import RandomForestClassifier

forest = RandomForestClassifier()
forest.fit(X, y)

importances = forest.feature_importances_
std = np.std([tree.feature_importances_ for tree in forest.estimators_], axis=0)
indices = np.argsort(importances)[::-1]

# Print the feature ranking
print("Feature ranking:")

for f in range(X.shape[1]):
    print("{}. feature {} ({:.3f})".format(f + 1, X.columns[indices][f], importances[indices[f]]))

# Plot the impurity-based feature importances of the forest
plt.figure()
plt.title("Feature importances")
plt.bar(range(X.shape[1]), importances[indices],
        color="r", yerr=std[indices], align="center")
plt.xticks(range(X.shape[1]), X.columns[indices], rotation=45)
plt.xlim([-1, X.shape[1]])
plt.show()
참조
- soohee410.github.io/iml_tree_importance
- towardsdatascience.com/the-mathematics-of-decision-trees-random-forest-and-feature-importance-in-scikit-learn-and-spark-f2861df67e3
'Machine Learning Models > Classic' 카테고리의 다른 글
| Feature Selection - XGBoost (0) | 2021.04.17 |
|---|---|
| Feature Selection - Random Forest (2) (0) | 2021.04.16 |
| Feature Selection - Recursive Feature Elimination (0) | 2021.04.09 |
| Feature Selection - Permutation Feature Importance (0) | 2021.04.09 |
| Feature Selection - BORUTA (2) (0) | 2021.04.08 |


